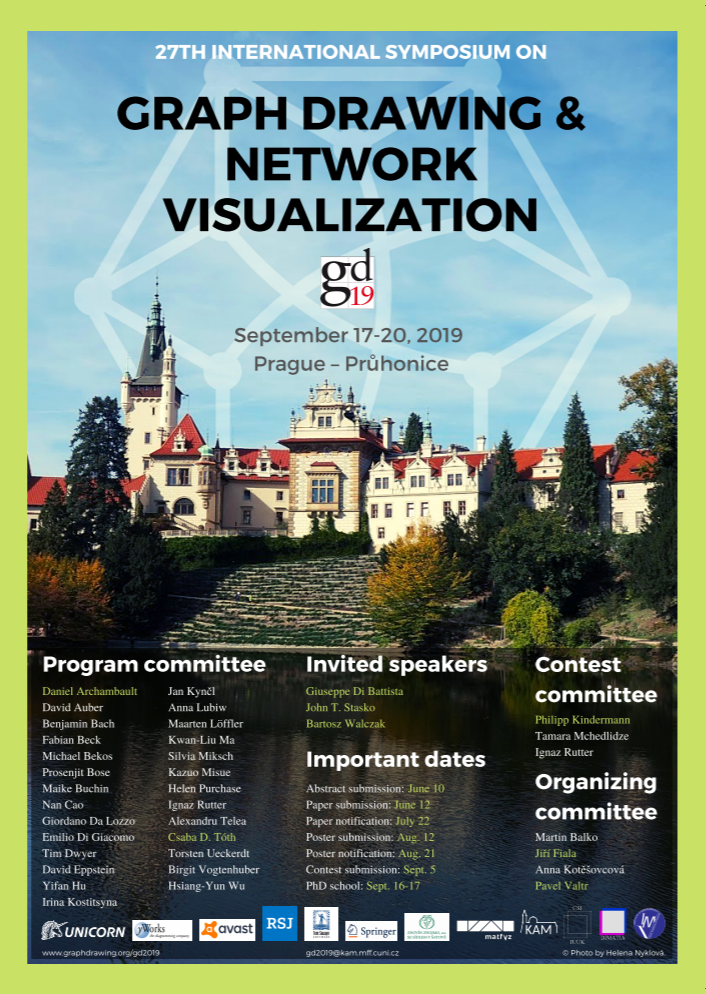
Graph Drawing and Network Visualization
Průhonice/Prague, September 17-20, 2019


Giuseppe Di Battista
Roma Tre University
Rome

John T. Stasko
Georgia Institute of Technology
Atlanta

Bartosz Walczak
Jagiellonian University
Kraków
Guiseppe Di Battista: This is time in/for graph drawing
In all fields of science and technology graph-inspired models are used to represent and understand reality, and the effectiveness of such models is often related to their graphical representation. this motivates the birth and the development of graph drawing as a self-standing scientific discipline.
During its evolution, lasting about half a century, graph drawing successfully faced several challenges, in some cases originated by the requirements of the reality to be represented and in some cases motivated by deep theoretical questions. this happened at the meeting point of the fields whose combination is the core of graph drawing, namely, algorithmics, computational geometry, graph theory and combinatorics, and information visualization (in alphabetical order).
One of the main challenges for Graph Drawing is the relationship between drawings and time (i.e., the temporal evolution of the visualized graphs). This relationship has been the subject of studies throughout the entire history of the discipline, as it is witnessed by the presence of about 40 papers on this topic in the Graph Drawing Conference Proceedings. On the other hand, this challenge inspired an even larger body of literature in the Information Visualization field. For several reasons, this literature has grown in a way that is largely independent from the Graph Drawing one.
We will discuss the main methods and techniques that the Graph Drawing community devised to deal with time, emphasizing their algorithmic, combinatorial, and geometric aspects, and considering their practical applicability to Information Visualization. We will focus on dynamic algorithms, streaming, animation, and morphing.
John T. Stasko: Pushing the Boundaries of Interaction in Data Visualization
People use data visualization for two main purposes, communication and analysis. On the analysis side, when the data being examined is of modest size or larger, it is difficult to imagine an effective visualization system without interaction. In this talk, I'll outline the value and uses of interaction for visualization, focusing on recent challenges and opportunities that have arisen. For example, what are good ways to interact with a visualization on a small screen without a mouse and keyboard present? And how can multimodal input, including speech and touch, assist people's interactions with visualizations? To answer these questions, I'll show examples of recent visualization projects, with a specific emphasis on graph and network visualizations.
Bartosz Walczak: Old and new challenges in coloring graphs with geometric representations
A central problem in graph theory is to compute or estimate the chromatic number of a graph, i.e., the minimum number of colors to be put on the vertices so that no two neighbors receive the same color. Being very hard in general, it has been considered for various restricted classes of graphs, in which the chromatic number remains in a tighter connection to the structure of the graph. This includes, in particular, classes of graphs defined on families of geometric objects: intersection graphs, disjointness graphs, visibility graphs, etc., motivated by practical applications in resource allocation, map labeling, and VLSI design. This area of research has seen remarkable progress in recent years. In particular, we have already quite a good understanding of which classes of graphs (with geometric representations) allow the chromatic number to be bounded by a function of the maximum size of a clique and which do not. Much less is known about the growth of these bounding functions, for instance, whether the chromatic number can be bounded by a polynomial of the size of the maximum clique.
The goal of this talk is to familiarize the audience with classical and new problems in coloring graphs with geometric representations, and to present some of the most recent developments, including a quadratic bound on the chromatic number in terms of the maximum clique size for circle graphs (intersection graphs of chords of a circle), due to Davies and McCarty.
🕫 20.9.2019: The list of awards and slides of all presentations are available.
🕫 17.9.2019: The proceedings are available online.
🕫 26.8.2019: List of accepted posters published.
🕫 24.8.2019: Program available.
🕫 24.7.2019: List of accepted papers published.
🕫 18.7.2019: Call for posters published.
🕫 18.2.2019: Call for papers published.
🕫 16.10.2018: The web page was launched.
Contact: gd2019@kam.mff.cuni.cz
Organized by:


In cooperation with:

Local arrangements are provided by:
CONFORG
Poster:
Gold sponsors:


Bronze sponsors:

Sponsors: